


Trump has now moved aggressively to cut back the U.S. childhood vaccine schedule — a schedule that had spent decades moving almost entirely in one direction: more. His administration’s attempted 2026 revision reduced the vaccines routinely recommended for all children, although that revision has been tied up in court.
Which raises a fun question: What if nobody had ever hit the brakes
?
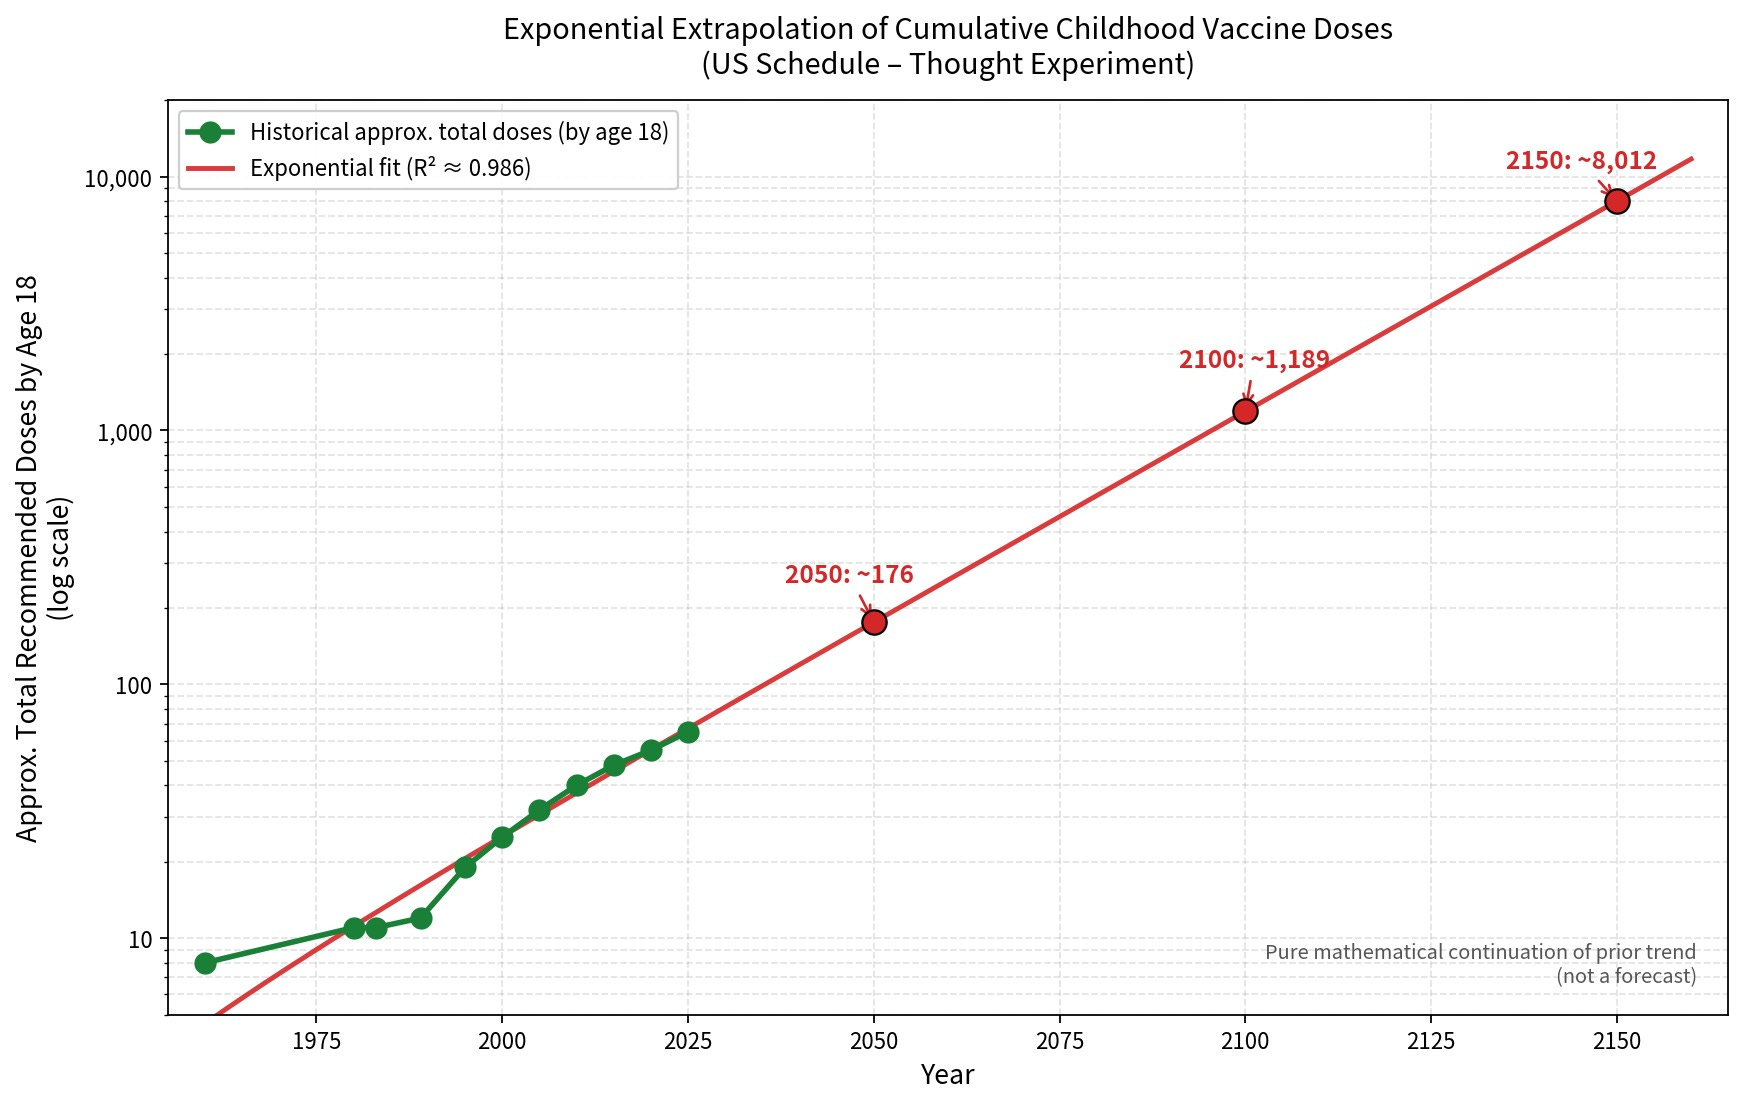
This graph is a thought experiment, not a forecast. Take the historical rise in cumulative recommended childhood vaccine doses through age 18 and fit an exponential curve to it. The striking thing is that it actually fits extremely well — about R² = .986 for the data plotted here.
Then simply let the curve keep going.
By 2050: ~175 doses per child.
By 2100: ~1,200.
By 2150: ~8,000.
Eight thousand doses by your 18th birthday. At that point childhood would presumably consist mainly of eating, sleeping, and stopping by CVS for your 1.2 daily vaccines.
Obviously, nobody seriously thinks we were headed for 8,000 childhood vaccine doses. That’s the point. Exponential extrapolation eventually becomes absurd because real systems encounter constraints and course corrections.
But there’s also something recognizable here about unchecked government growth: each individual addition can be defended on its own terms, while almost nobody is institutionally responsible for asking whether the accumulating whole has become ridiculous. Add one recommendation. Then another. Then another. Each has a rationale; the ratchet keeps turning.
You don’t have to be anti-vaccine to recognize that this kind of institutional ratcheting can itself become an illness.
The absurd 8,000-dose child is just the reductio ad absurdum: eventually somebody has to question the curve.
These various government regulations, rules, policies, procedures and so on tgat you say can be individually justified don't simply create complexity but they also create dependency loops where because C to B and B to A you can't change A but just so much let alone get rid of A. Sometimes this dependency is organic, sometimes its deliberate so as to prevent later attempts at course correction.
The only reason that hypothetical 8,000 vaccines would not happen has less to do with any system constraints than resistance by the public. With each vaccine the odds of more being harmed increases and eventually it would be more harm than the pharmaceutical industry could keep covered up and thus the public would at some point start to question, tgen doubt and finally resist. If it weren't for the publics eventual resistance theres no other limitations anywhere that #BigPharma wouldn't find a fix for due to the amount of $$ at stake and annually so.